The Digital Culture report has been published with the data for 2017. This study conducted by NESTA aims to capture the use of digital in arts and cultural organizations.
Three years ago I explored the results of the questions related to the use of data and existing data analysis skills. What has changed during these four years? Are cultural organizations increasing the use of data? Using the information from the data portal I created these graphs to look at these questions in depth.
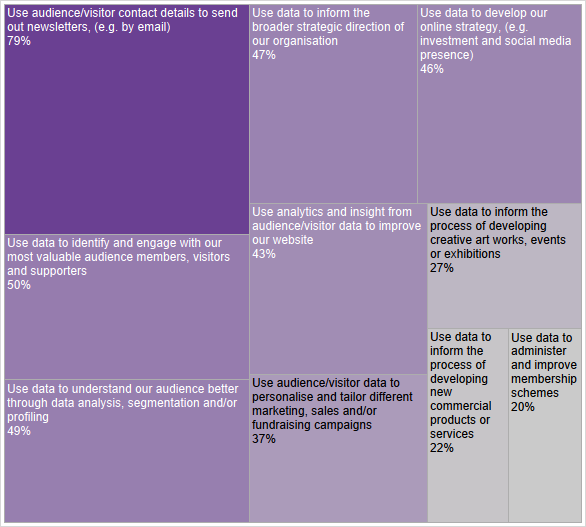
Looking at all organizations together, their main uses of data are to send out newsletters, to understand audiences better through data analysis, segmentation and/or profiling and to inform strategy. These are very similar results compared to previous Digital Culture surveys.
Thinking about how you use audience or visitor data (generated either through your own website, social media or through offline engagement), which of the following activities do you do?
In order to get a breakdown of this data by type of organization you can interact with this chart on Tableau Public.
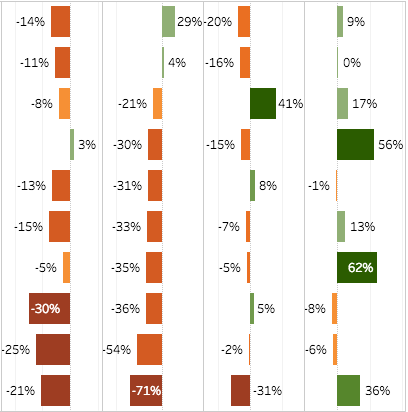
Interestingly,according to this study, museums are decreasing their data usage. However, if we look at the data by organizations’ turnover we can see that museums with high budgets are increasing the use of data while smaller museums are significantly decreasing its use. So how small and medium museums can build their data capture and analysis capacity?
MUSEUMS – Thinking about how you use audience or visitor data (generated either through your own website, social media or through offline engagement), which of the following activities do you do? (Variation 2013 vs 2017)