The usage of mobile devices at museums continues to increase. Visitors use them to share their experience on social media, download an app or check the museum’s website to find information. In the past few years museums have allocated resources to build responsive websites and today there is an ongoing debate about whether or not apps are actually needed.
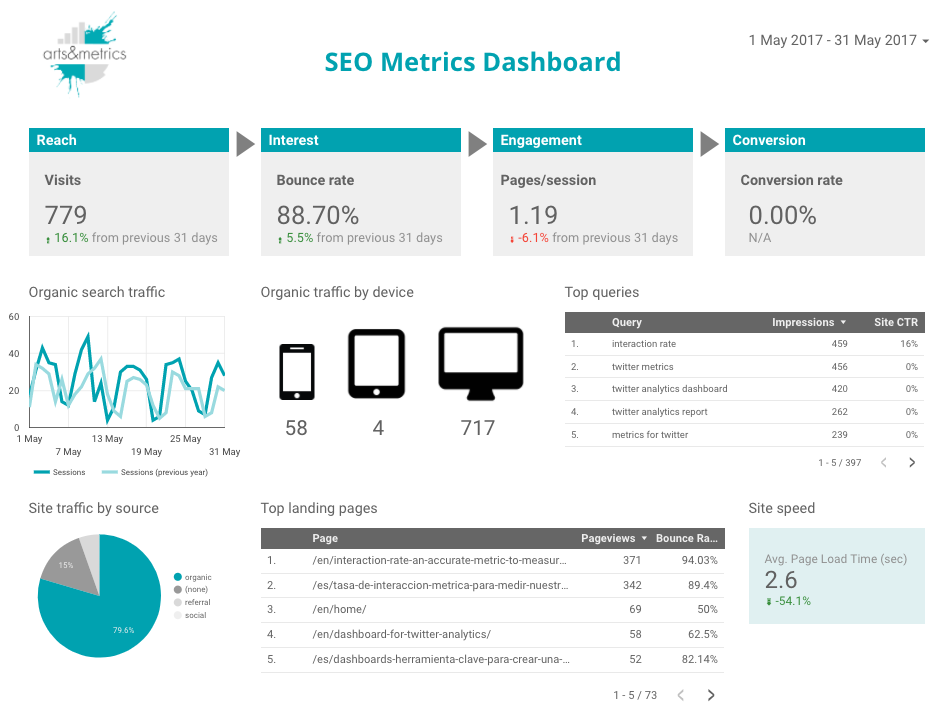
So, how are your visitors using your site or app while they are at the museum? What do they need during their visit? What are the pages they are visiting? How long they spend on the site? What are they searching for? What is their language? This information can help you to improve the mobile experience for onsite visitors and to create a good user journey from your Wi-Fi welcome page if you have one. You can use tools like Google Analytics to filter the traffic and create a view (profile) that shows the website behavior of those users who connect to your Wi-Fi. It will exclude visitors using their mobile data plan but you can still find very relevant information.
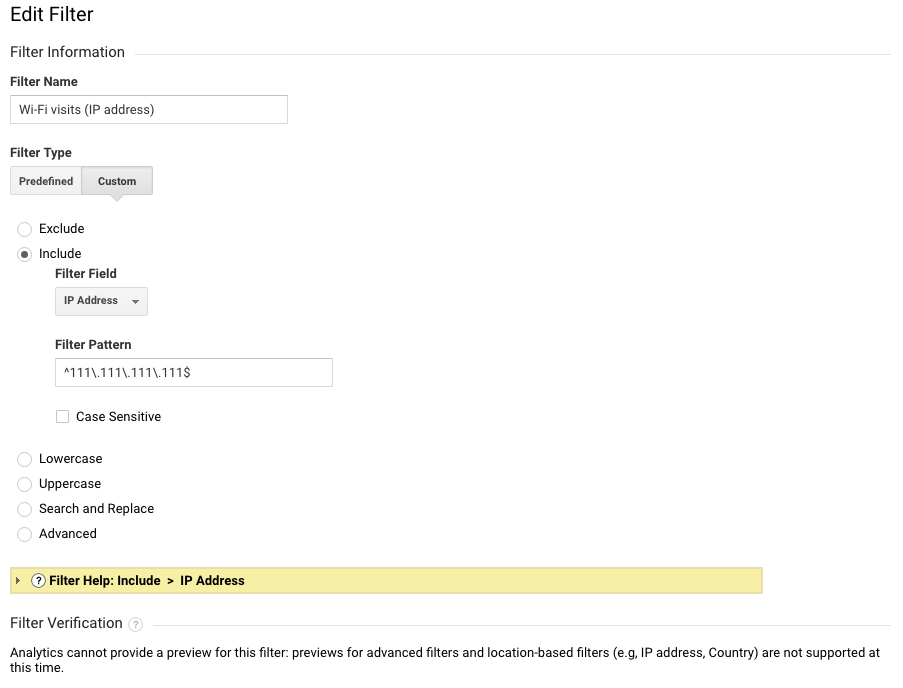
In order to create this view you need to add a filter to segment the Wi-Fi traffic. The best way to do this is with the Wi-Fi’s IP address but it could also be created by using the network name. The following image shows how to configure the filter. You may need to use a regular expression to set up tools for different IP exclusion and inclusion scenarios.
Some research questions you may be interested in digging into are:
- How do they arrive to the site (e.g. wi-fi welcome page, Google search, social media…)? (Acquisition report)
- How long do users spend on your site? (Audience report)
- What is the content that visitors are viewing during the visit? Opening times, facilities, events for that day, current exhibitions, list of objects on display? (Content report)
- Which Collection objects do people access? (Content report)
- What is the user journey? (User explorer report)
- What are people searching for? (Site search report)
A great recent example on how to use this type of data to understand the onsite mobile experience is found on this paper “A Location Based Understanding Of Mobile App User Behavior” by Diana Marques, Brian Alpert and Robert Costello, where they analyze the behavior of app users while they utilize them in the galleries and offsite.